Tapad Identity Visualization
Interactive, audience-specific sales narrative with a gated, data-driven visualization.
The Tapad Identity Visualization was a project at Column Five aimed toward driving new sales for Tapad. The site customizes the experience based on what industry the potential customer is associated with. I was one of two developers and I was primarily responsible for the gated map portion of the interactive for the first phase and then making updates to the narrative portion of the site as well as making it mobile responsive.
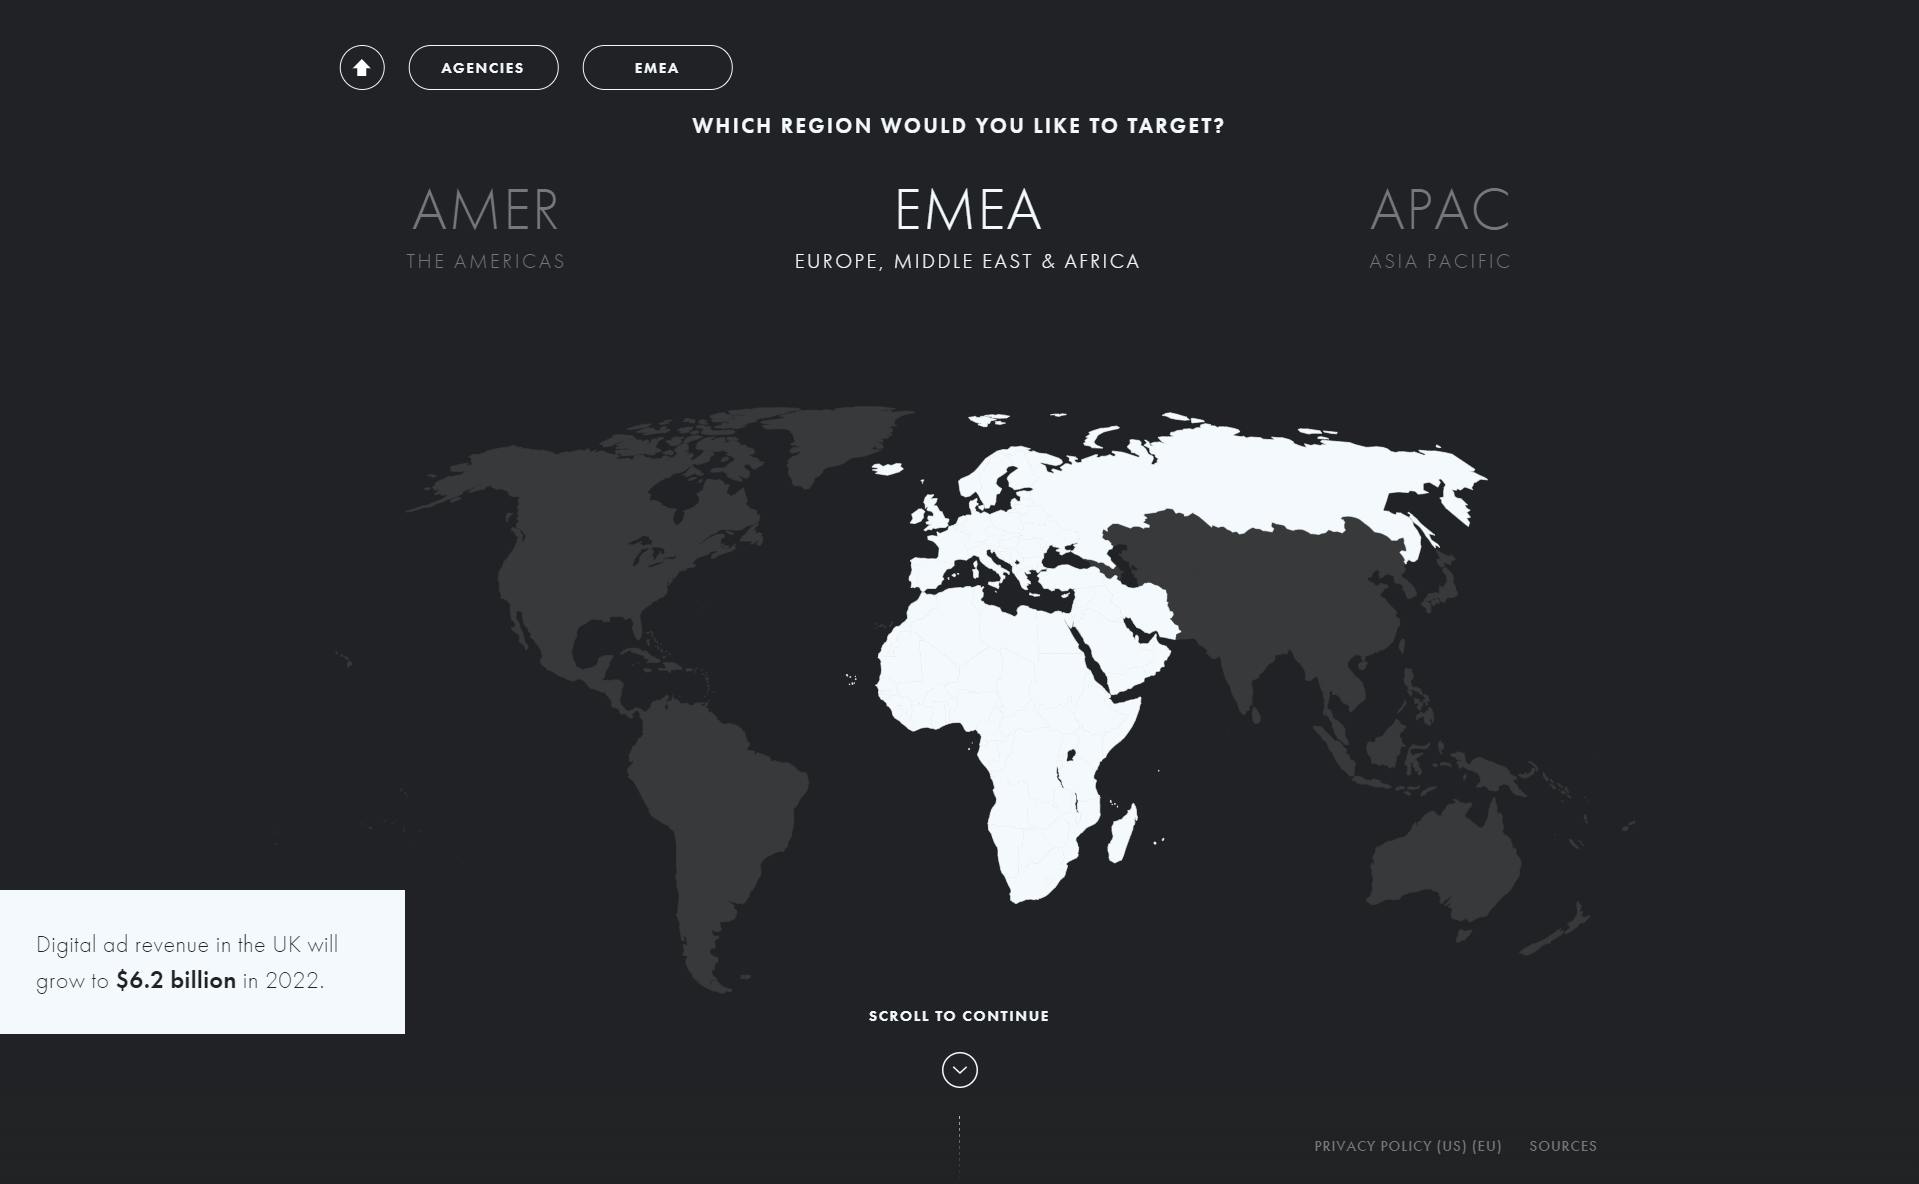
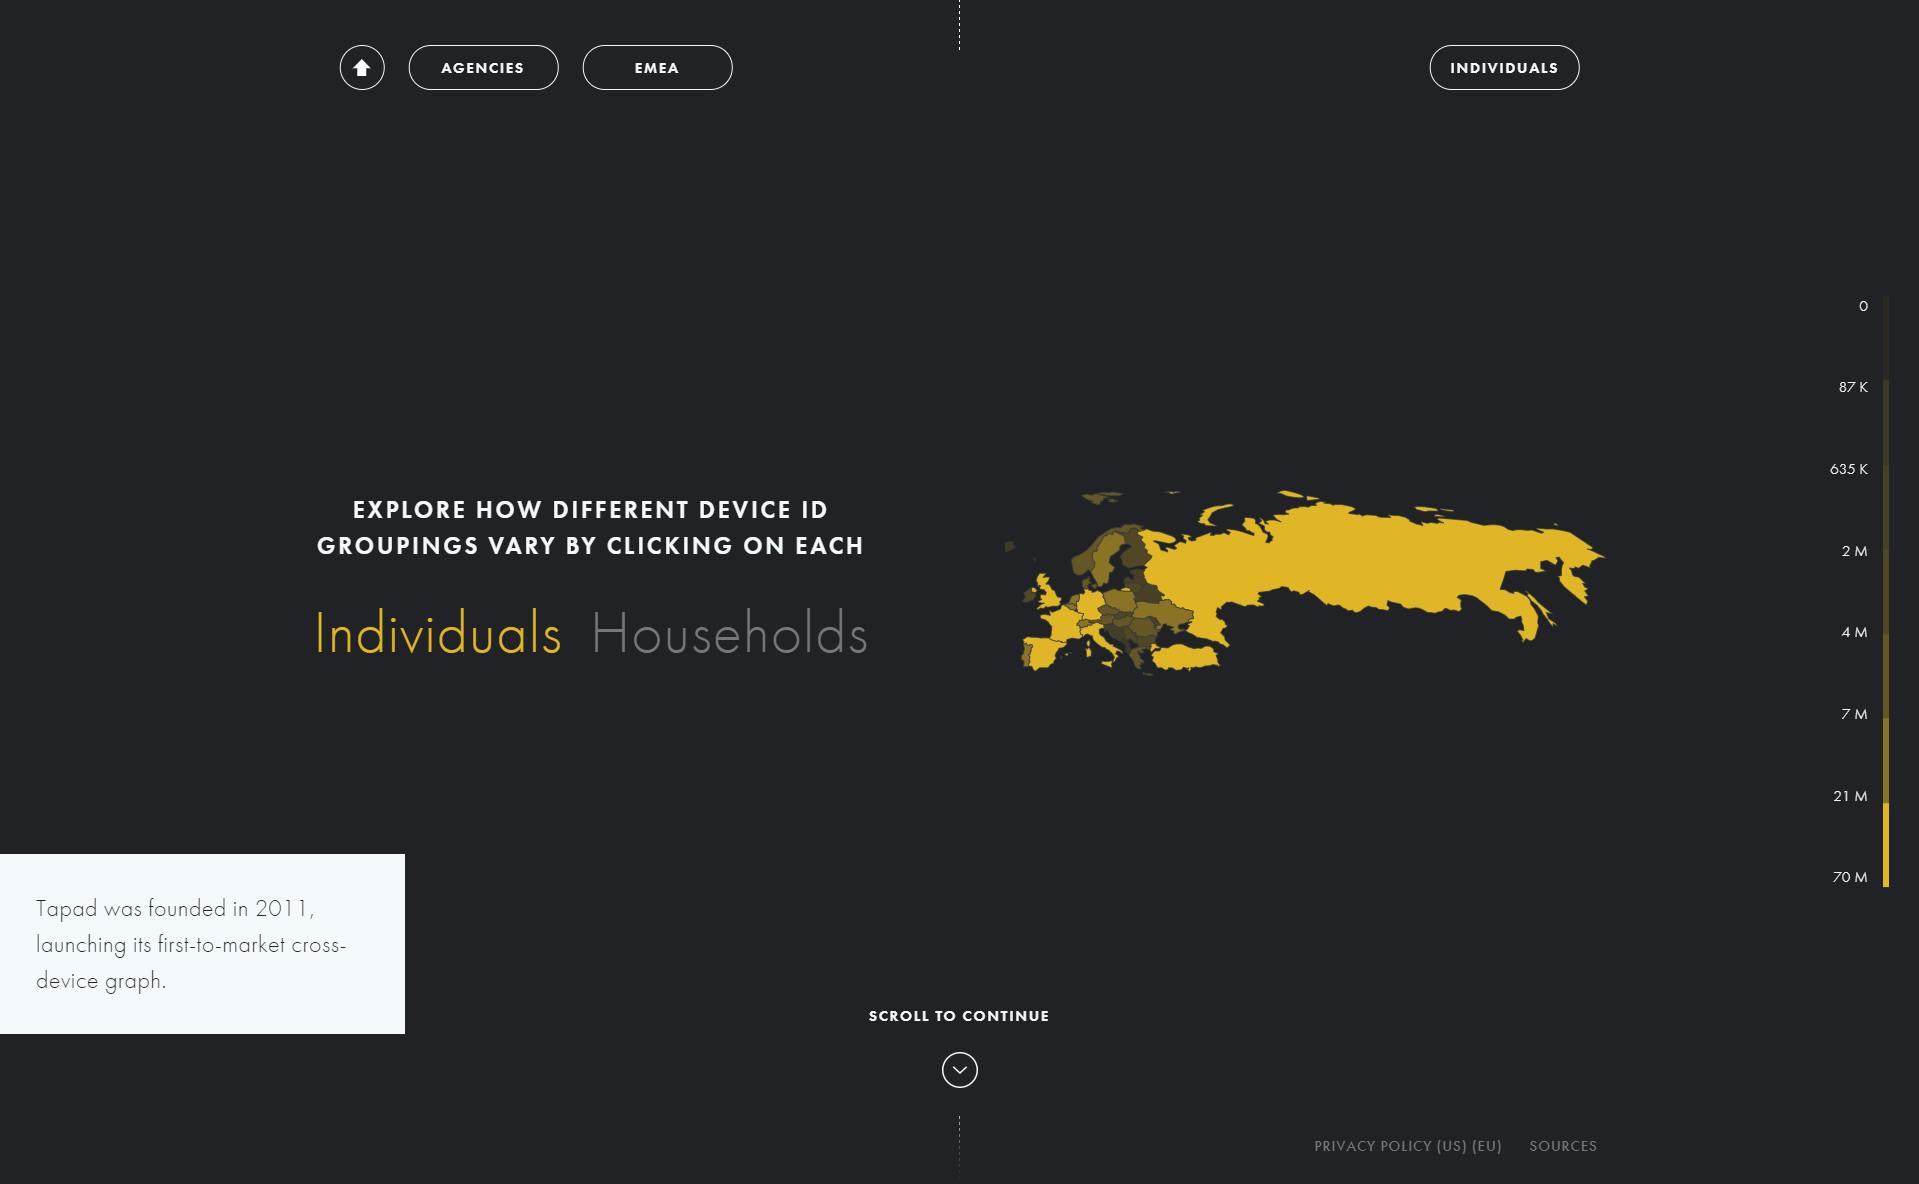
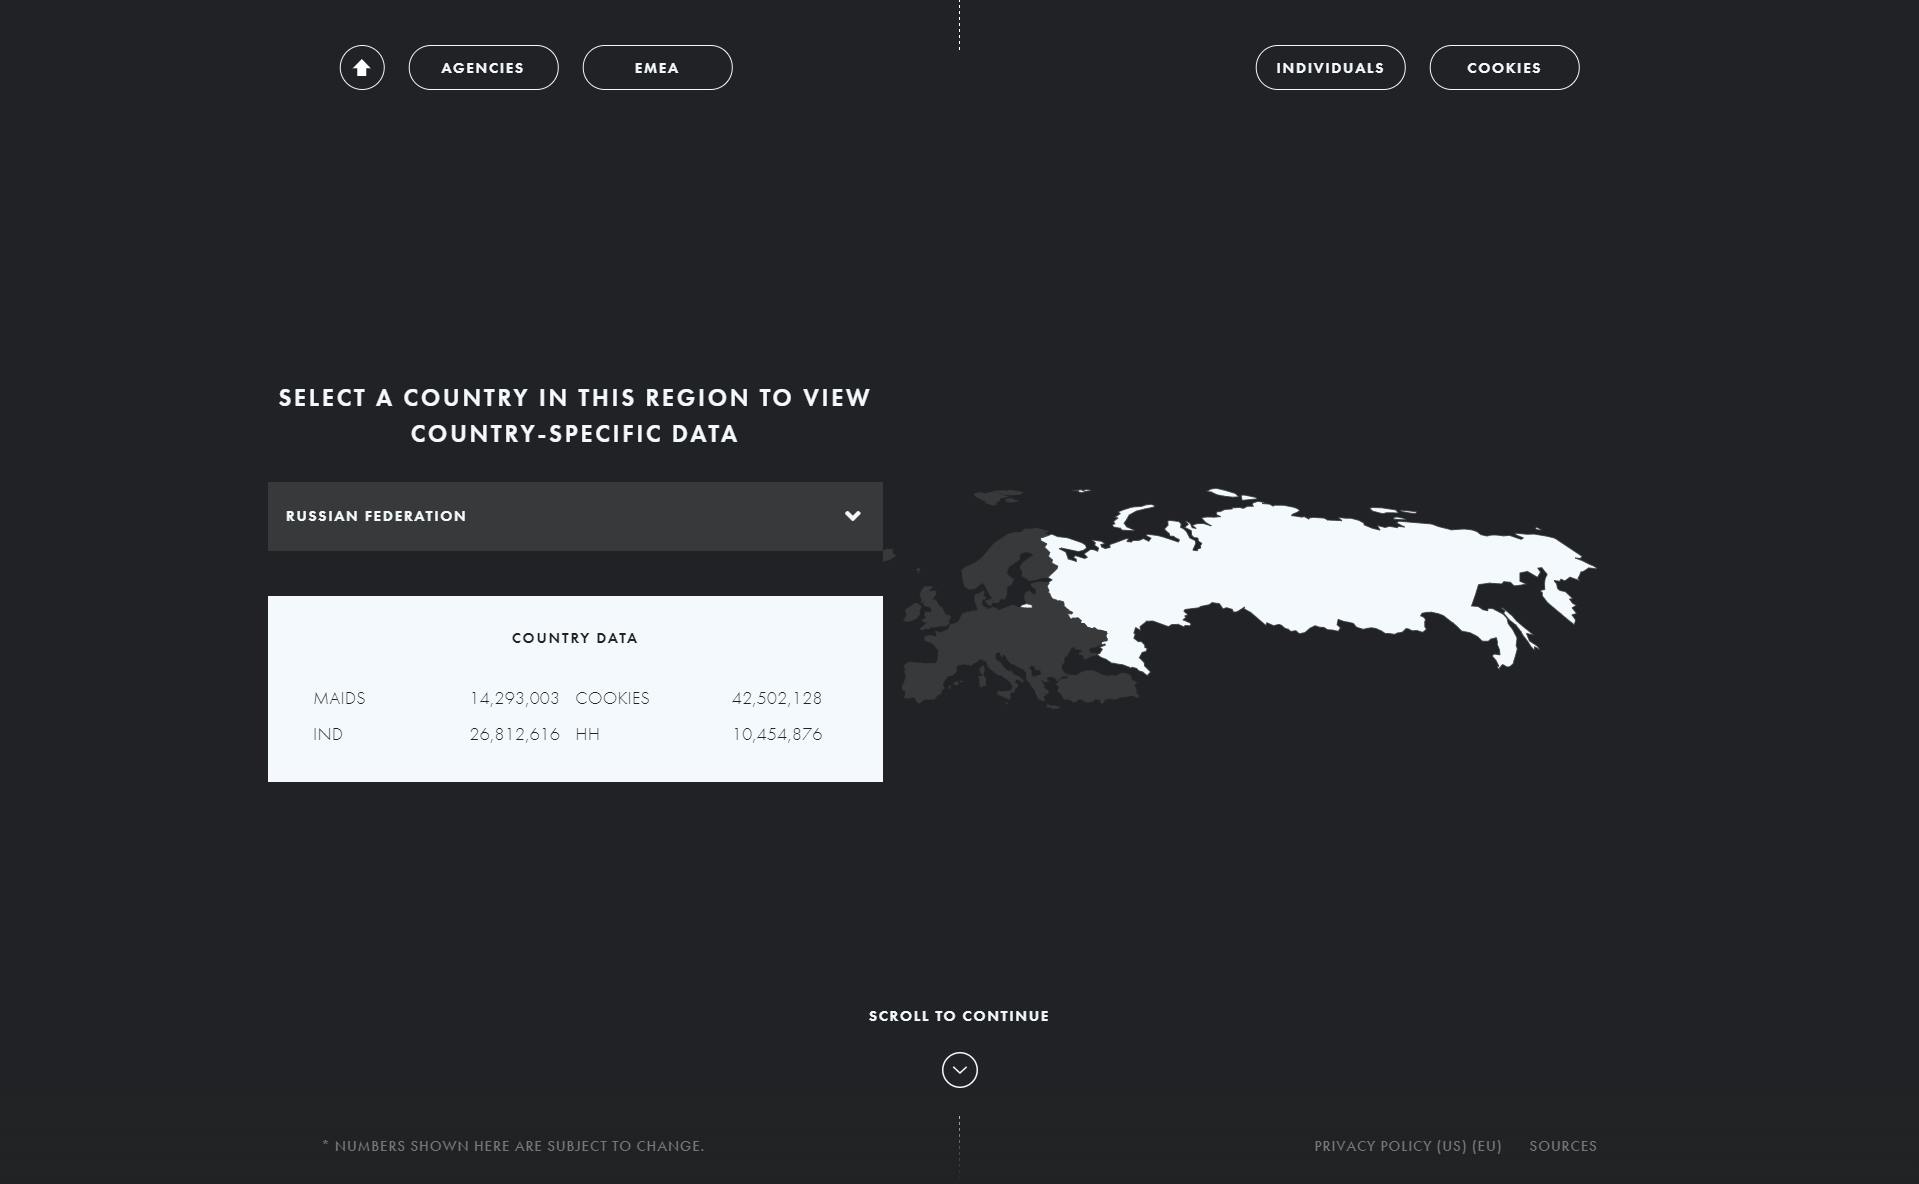
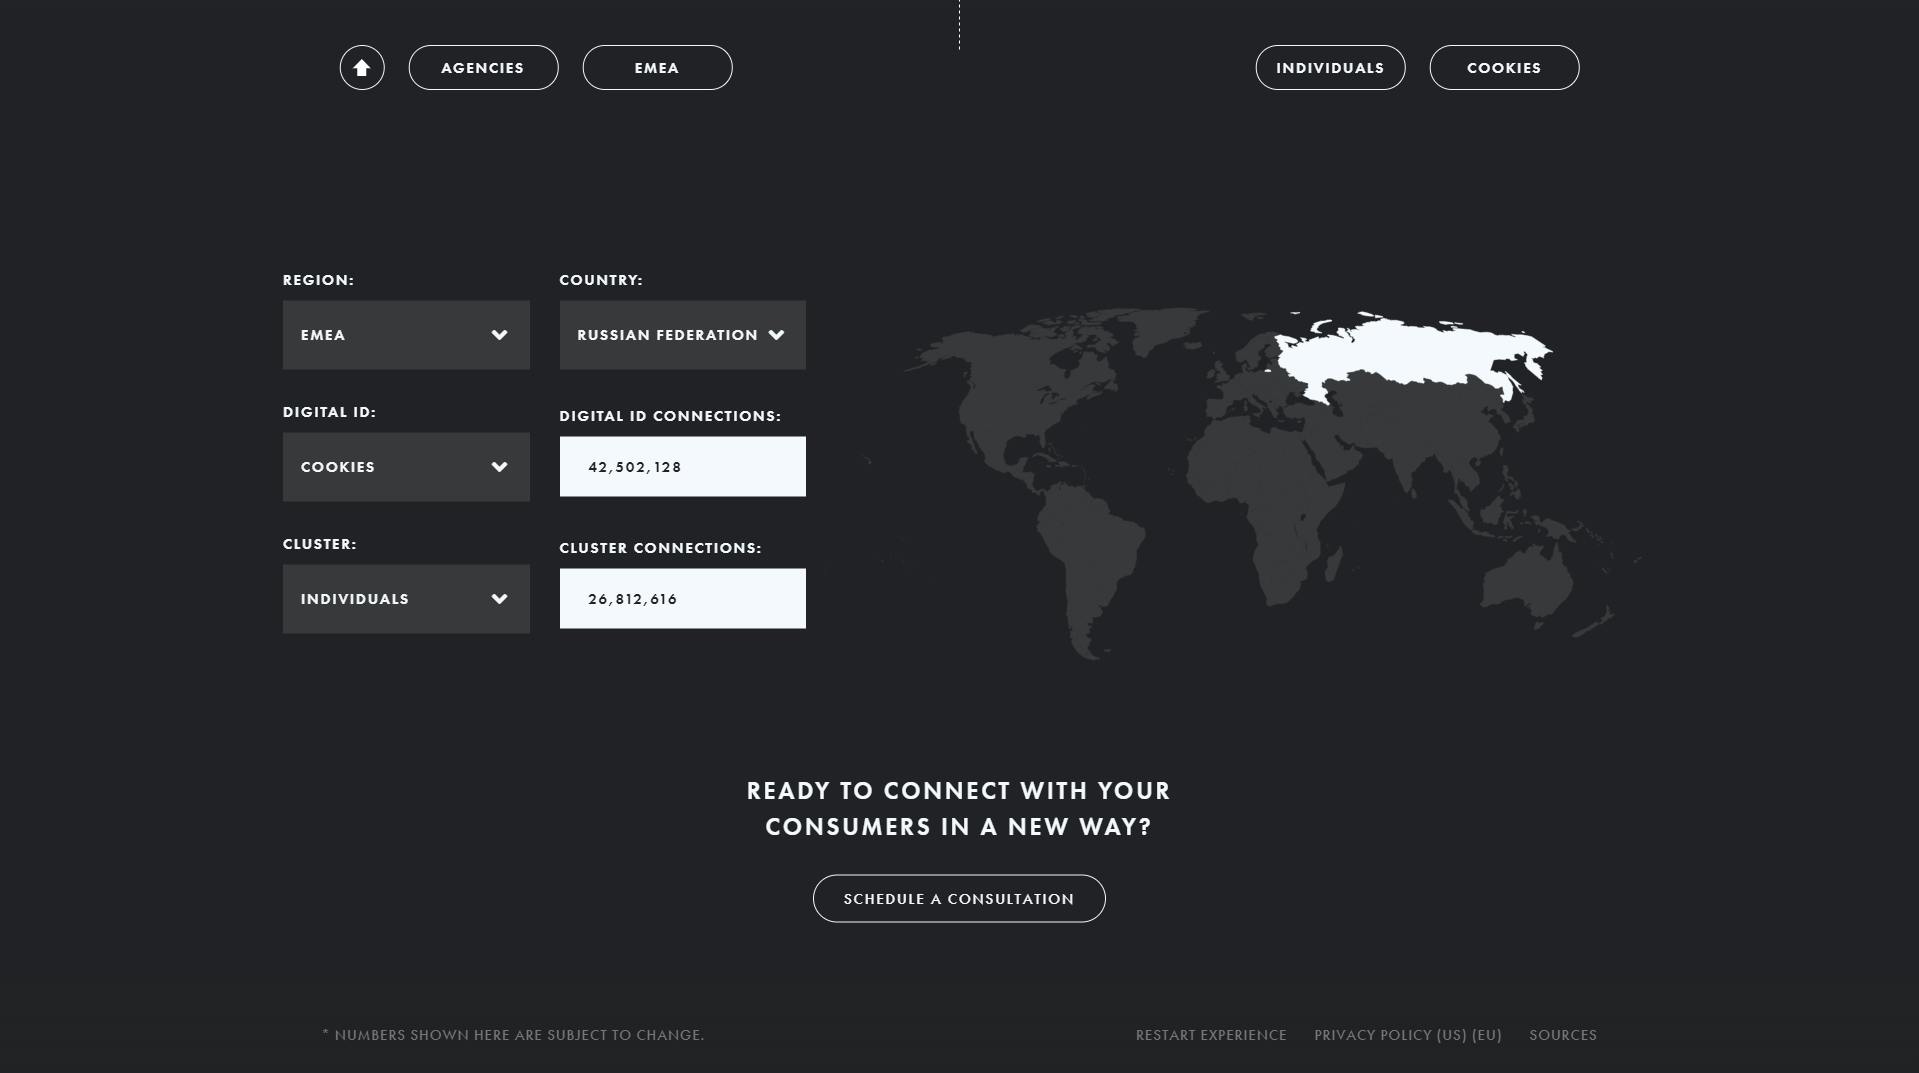
Tapad sent us an Excel document with map data that is used to dynamically populate a map with their proprietary system's reach across the world. Users can view this data by region, country, household, individual, as well as two Tapad-proprietary metrics: MAIDs, and CTVIDs.
A potential customer can request a code using this site to access this map. The information captured is transferred to HubSpot for Tapad's sales team and a unique code is generated and emailed to the new lead. The new user can access the map with this new code immediately.
The map is manipulated with D3, starting from a static SVG with ID's corresponding to the country's ISO codes. The form processing and code validation is handled with PHP, using the Slim framework. This PHP code communicates with the HubSpot API via cURL. Front-end and back-end code for this site communicate with a basic JSON REST API. Animations were done by a motion designer at Column Five and exported from Adobe After Effects using Lottie and rendered using Lottie's javascript library.
Photos